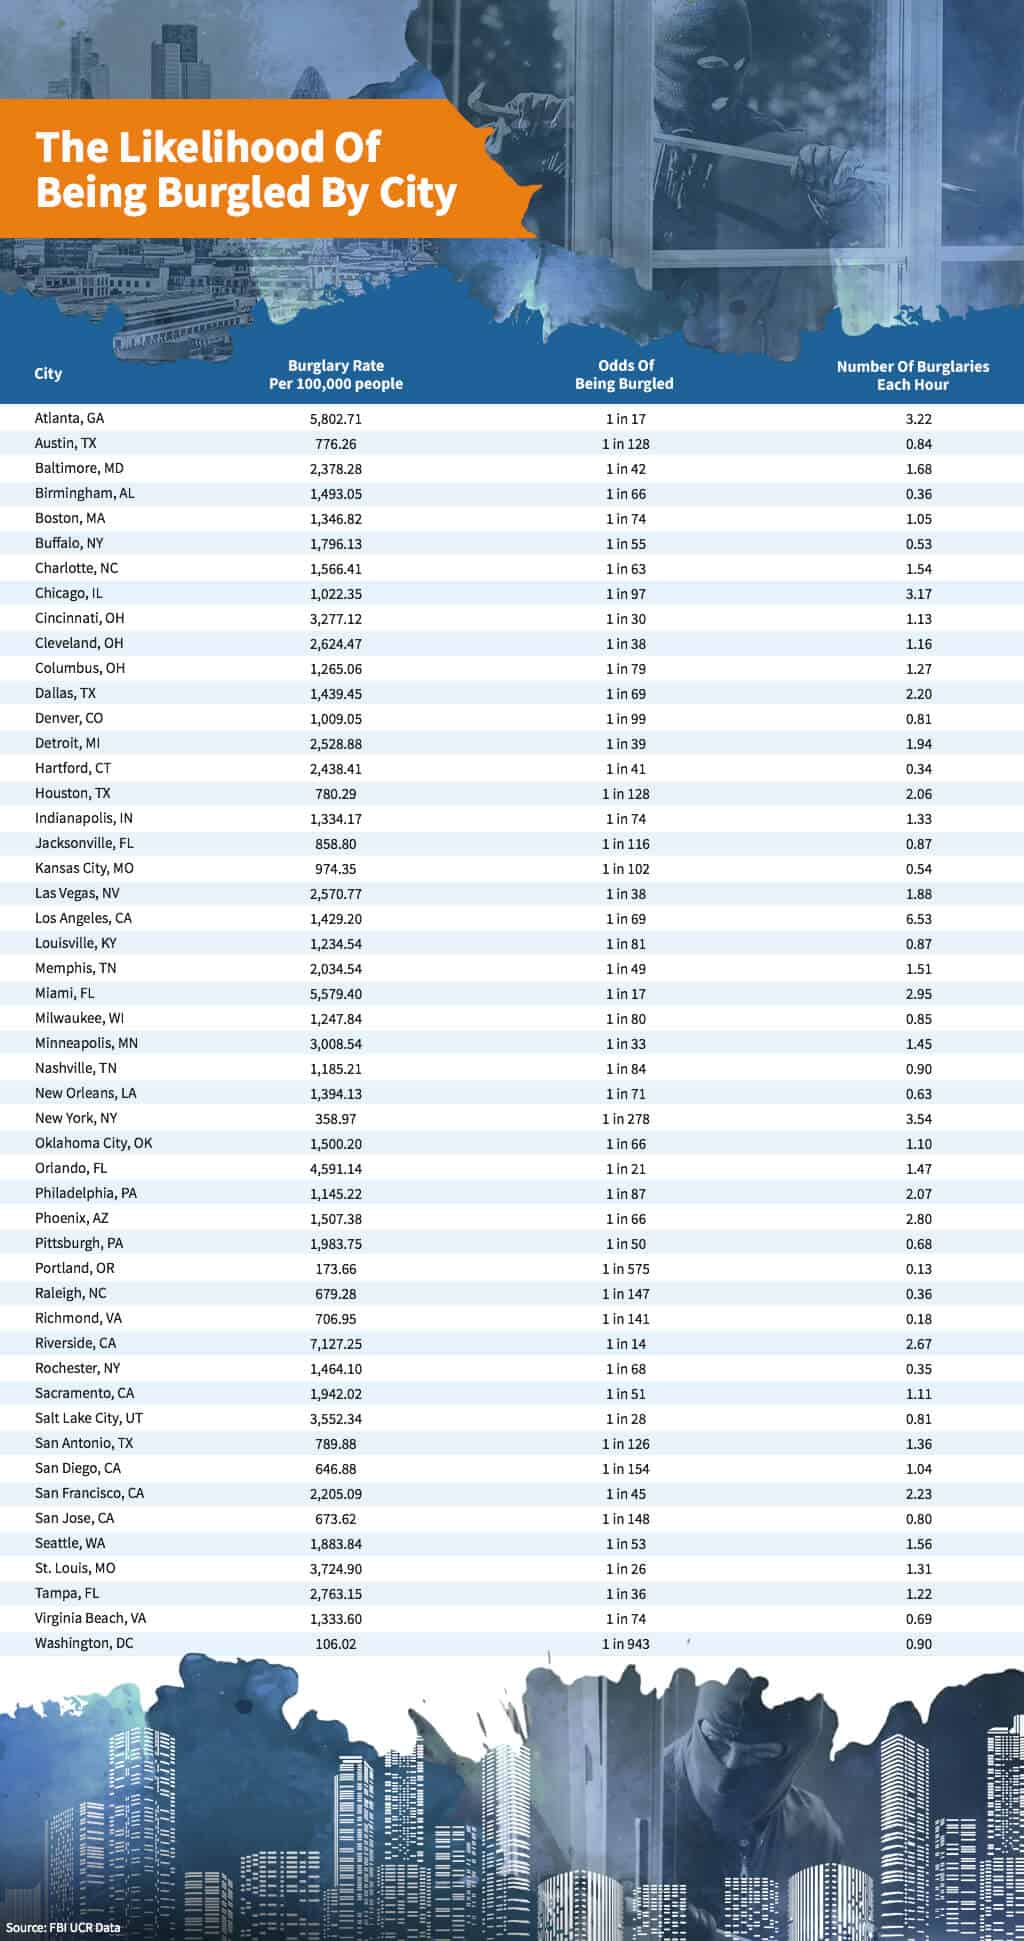
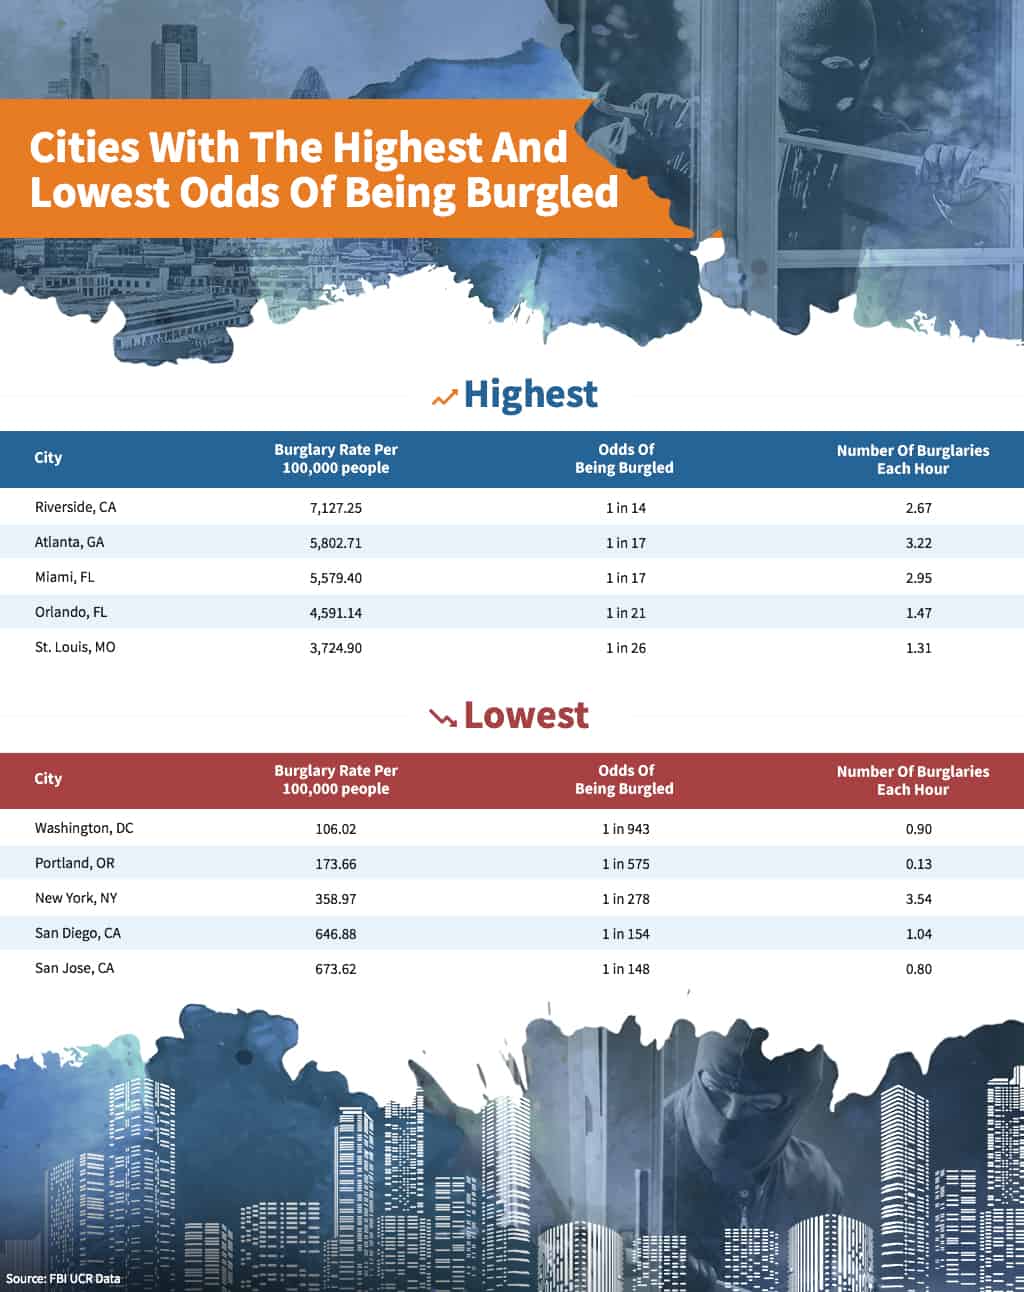
These infographics by CheckVideo sum up what the chances of being m in each US city are, and what cities are more dangerous than others in terms of this metric. The charts were made using data from FBI Uniform Crime Reporting Data and City-Data.com.
Overall, the chances of being a victim of burglary range from 1 in 14 to 1 in 943 across the top 50 cities in the country, which is quite a significant range!
A sociologist and English major by degree, I've worked in the area of civil society & human rights and have been blogging in the fields of travel, nature & science for over 20 years.
Check out my other project (especially if you're planning to visit Budapest soon) 👇
 Donate


Related Posts
Life in Whittier, the Alaskan Town With 90% of the Population Living in a Single Apartment Building
Rare Wave-Shaped Clouds Captured by Sky-Watcher in Wyoming
Tomorrow Island (Russia) and Yesterday Isle (USA) Are Just Three Miles Apart But There’s a 21-Hour Time Difference Between Them
This ‘Welcome to Cleveland’ Sign On a Rooftop in Milwaukee Has Been Confusing Airline Passengers for Decades
This Bonsai Tree Is Almost 400 Years Old and Has Even Survived the Hiroshima Bombing
Nobody Knows Who Has Left These Mysterious Instructions for the Post-Apocalypse
Animated 8-Bit Pixel Map of the USA
Map of Political Apathy in the United States
All Place Names in North America Containing the Words Forest, Lake, Mountain etc
Most/Least Remote Areas in the USA